 Energy Saving Measures | Use of Non-fossil Fuels
Use of energies that leave less burden on the environment
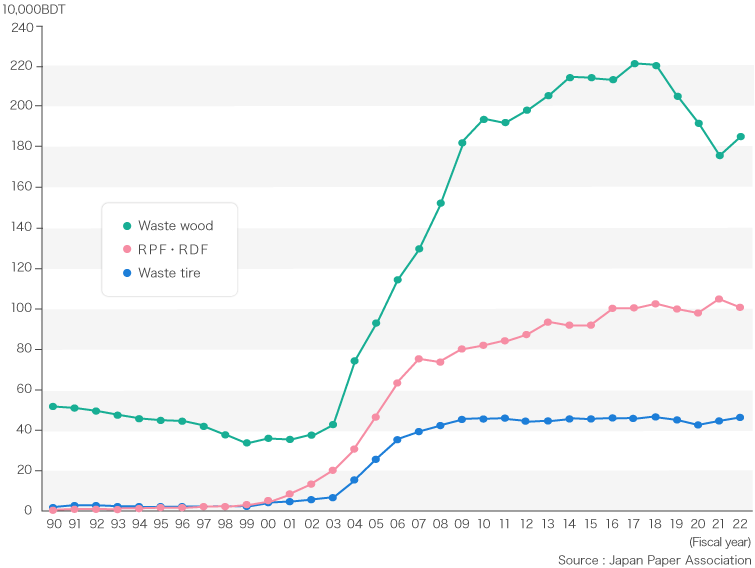
As a part of the climate change (CO2 emissions reduction) measures, the Japanese paper industry uses black liquor, waste wood chips, paper sludge and other biomass as well as RPF, waste tires and other combustible waste (see Table 1). The consumption of these non-fossil energy sources in the industry has been on the rise (see Fig. 1).
Table 1 Glossary of energy-related terms
| Biomass | Renewable organic substances (mass) generated by living bodies (bio). These include plants, animal excreta, kitchen waste and other organic resources. The CO2 emission from biomass is considered as a part of the natural environmental process and does not count as CO2 emission in pertinent international agreements. | |
|---|---|---|
| Black liquor | Waste liquid generated in the wood pulp production process to take out fibers out of wood. A kind of biomass. | 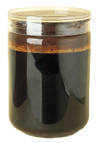 |
| Paper sludge | Organic sludge containing fine fibrous materials generated in the papermaking process. A kind of biomass. | |
| RPF | Made of non-recyclable recovered paper and waste plastics. RPF has thermal energy comparable to that of coal. A kind of waste-derived fuel. | 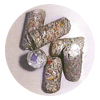 |
Figure1 Consumption of biomass and waste energy
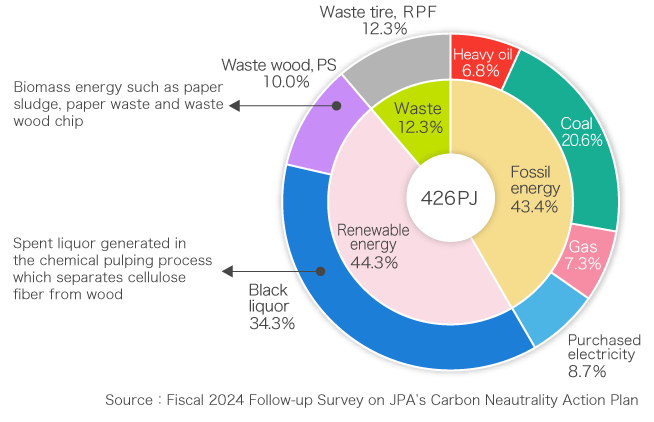
In this way, the Japanese paper industry has constantly worked to develop and use non-fossil energy sources. As a result, the breakdown (Fig. 2) shows that currently about one half of the energy is filled by renewable or waste-based energies. This high use ratio of environment-friendly energies is one of the major characteristics of energy consumption by the industry. The generated cinder is used also effectively as a raw material of cement or as a soil improver. The industry’s big goal of the paper industry is to further promote the switch to energies of less environmental burden.
Figure2 Composition ratio of energy consumption in the paper industry by source (2024)